Satellite data
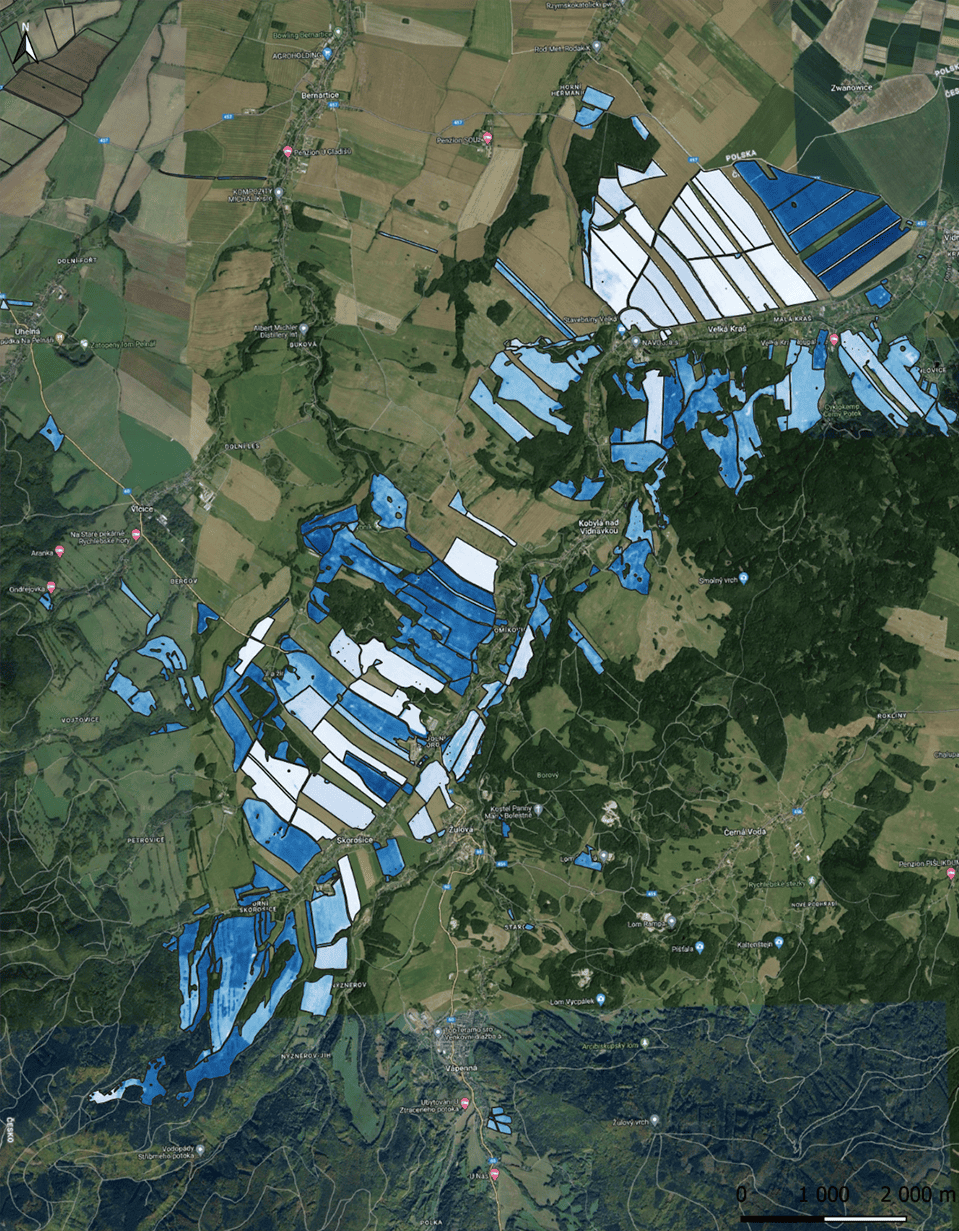
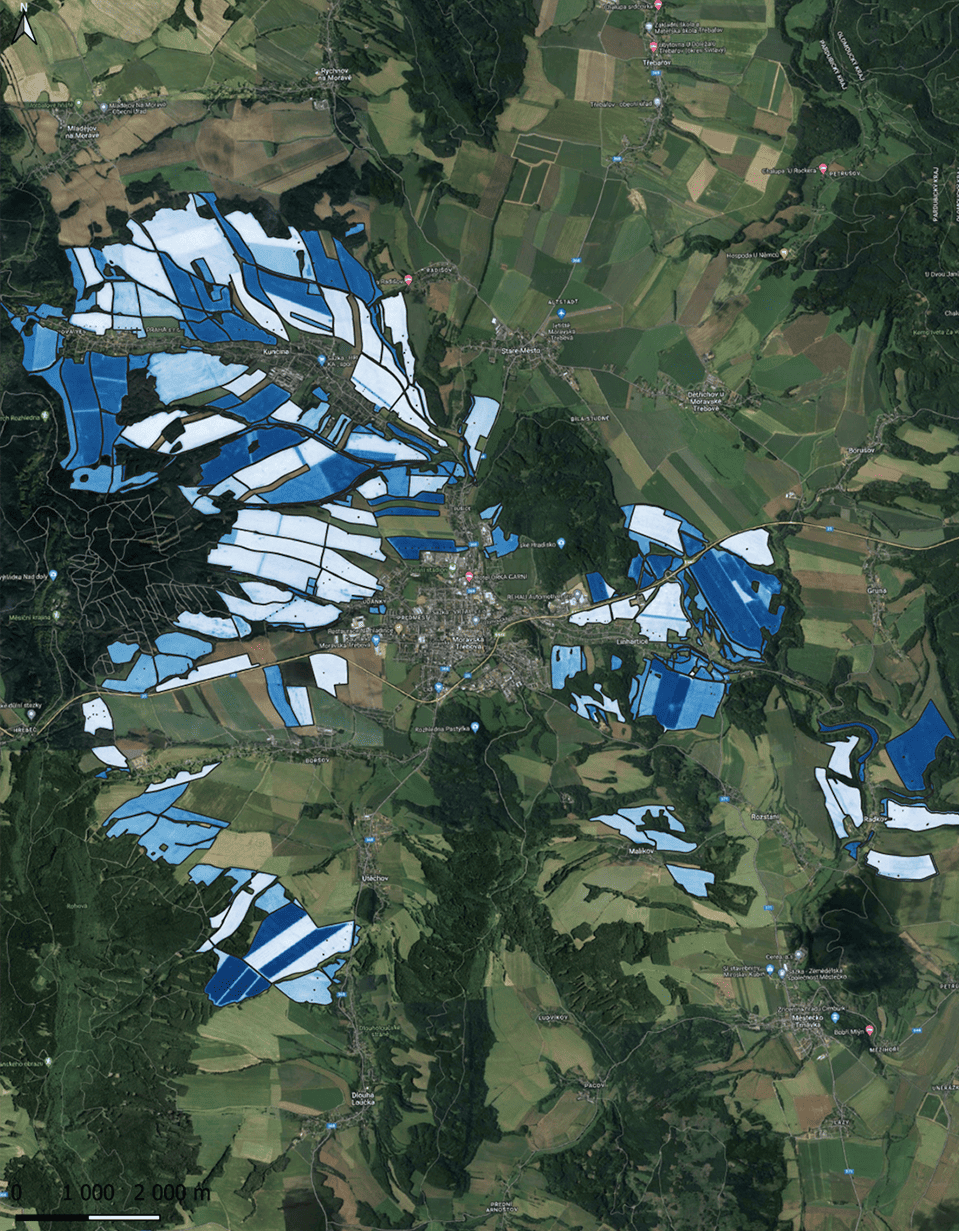
Based on satellite data PlanetScope we bring you a detailed overview of the current state of growth with high accuracy. Thanks to the use Vegetation index SAVI, which minimizes the influence of the soil, we divide the field into 13 agronomically important zones according to the development of the vegetation. Spatial resolution images 3 meters per pixel and a frequency of 1-2 days allow for more frequent monitoring, especially during the key spring period. All this contributes to better awareness, decision-making and more efficient management of agro-technical interventions.
Zone Management
Zone Management express long-term field variability based on the time series of satellite data. They arise from more than 300 images Sentinel-2 since 2015, with images with cloud cover, no vegetation or images influenced by agrotechnics removed. The resulting average frame according to the SAVI index is then divided into Five Zones using the Natural Breaks algorithm (Jenks). These zones can serve as a substrate for variable sowing or fertilizing.
CLAY INDEX
SAVI (Soil-Adjusted Vegetation Index) is a vegetation index that displays the current state of the vegetation and reduces the influence of the soil. On its basis we create zones with different state of vegetationthat can serve as a basis for variable applications. SAVI values change over time, so you can easily tell if the growth is below average or in excellent condition in a given period. This makes it possible to plan agronomic interventions better and respond effectively to the current state of vegetation on a particular plot.
+ more infosoil and plant analysis
Soil samples provide detailed information about the chemical properties of the soil on your property. The analysis will reveal any nutrient deficiencies that can negatively affect the growth and yield of crops. Based on the results, fertilization can be better planned, production quality can be improved and long-term soil health can be promoted.
The results of the analyses also serve as a basis for the creation of prescription maps for variable fertilisation. Samples are taken in any grid, we process them in modern laboratory of ALS and their outputs are available directly in the CleverFarm application. In addition to standard analyses, we can also provide other types of analyses including physical properties of soil.
In addition to soil samples, we also carry out aboveground biomass analyses, so-called foliar analyses, which are used to determine the current state of plant nutrition, especially in relation to the content nitrogen and microelements.
application maps
In CleverFarm you can easily generate application maps for individual parcels and in bulk for multiple parcels at once based on the available data bases. Thanks to this, you can prepare maps for fertilization, sowing or other interventions simply and quickly. In addition, CleverFarm will notify you of possible violations of legislative restrictions.

Application map formats and data transfer to machines
CleverFarm allows you to generate application maps for all types of terminals, that support map uploading for variable applications. For brand machines Fendt, John Deere, Massey Ferguson, Valtra, New Holland, Case, Steyr, Raven and Ag Leader In addition, we offer the possibility of remote data transfer directly to the machine. This will save time and the operator will avoid possible problems and errors when recording maps via USB. We work with native equipment of machines without the need to install additional terminals.
CleverFarm can generate application maps in the following formats: Shapefile, Trimble FMX, Precision 20/20 Shapefile, Raven Viper, Satloc-G4, Satloc-Bantam, SiteMate, TeeJet ISOXML, Trimble AGGPS 170 Prescriptions, Trimble FMD, John Deere GS1, GS2, GS3, Global Rx and GS2/GS3 Rx Shapefile, Kinze BlueVantage, Kinze Multi-Hybrid Shapefile, Mid-Tech, Müller ISOXML, Case Voyager2 (including raster version), Generic ISOXML Type 1 and 2, Pro700 TaskData, Pro700 Shapefile, AGCO AccuTerminal, Fendt VarioTerminal, Ag Leader TGT Publisher, IRX, AGSETUP, InCommand, AgView and AIM.
After exiting the application, you can view detail of the task performed (so-called as applied record) and check the correctness of the execution of the application. CleverFarm supports file visualizations in isoxml format. For brands It is possible for Fendt, Massey Ferguson and Valtra to transfer data remotely from the terminal to the CleverFarm application.
+ more infoeconomic evaluation
Throughout the season you we help collect and evaluate data, adjust strategies and respond to current developments. At the end of it, we prepare detailed evaluation of precision agriculture — taking into account meteorological conditions, yields, economic impacts, nutrient balance and nitrogen utilization. All this down to the level of individual parcels or zones.
The output also includes recommendations on how to optimize farming in the upcoming season.
Yield
MAP
Yield maps from harvesters show exactly how much you reaped at each field location. Thanks to them you will find out the real impacts of your agronomic interventions. The CleverFarm platform cleans the yield data, aggregates from all used machines, adjusts any deviations and uses it as a basis for detailed economic evaluation of the entire season.
Supply of Pure
nitrogen
The net nitrogen supply map shows the total amount of nitrogen delivered to individual parts of the field during the entire growing season. It includes the sum of all nitrogen fertilizer applications in a given period. Combined With a yield map, it is possible to calculate the so-called PFP index, which evaluates the efficiency of nitrogen utilization on individual parts of the plot.
PFP
The index
PFP-N (Partial Factor Productivity) states, how many kilograms of yield was achieved per kilogram of applied nitrogen. This indicator helps to evaluate Fertilization efficiency — the higher its value, the better the plants use the supplied nutrients and the lower the risk of over-fertilization or inefficient use of nitrogen.
Would you like to see a sample of our evaluation?
Contact us and we will send you in no time a sample presentation with an economic and agronomic evaluation of the whole season.
I want to send a sample evaluationChci zaslat ukázku vyhodnocení