CleverFarm Telematics automatically detects the transition from field work to transport by comparing the vehicle’s trajectory with field boundaries and, through the attached implement, automatically identifies the type of operation performed on the field. Each transfer, field operation, or driver record is consolidated into a single, clear record in the system. If you need more detail, individual trips can also be viewed separately.
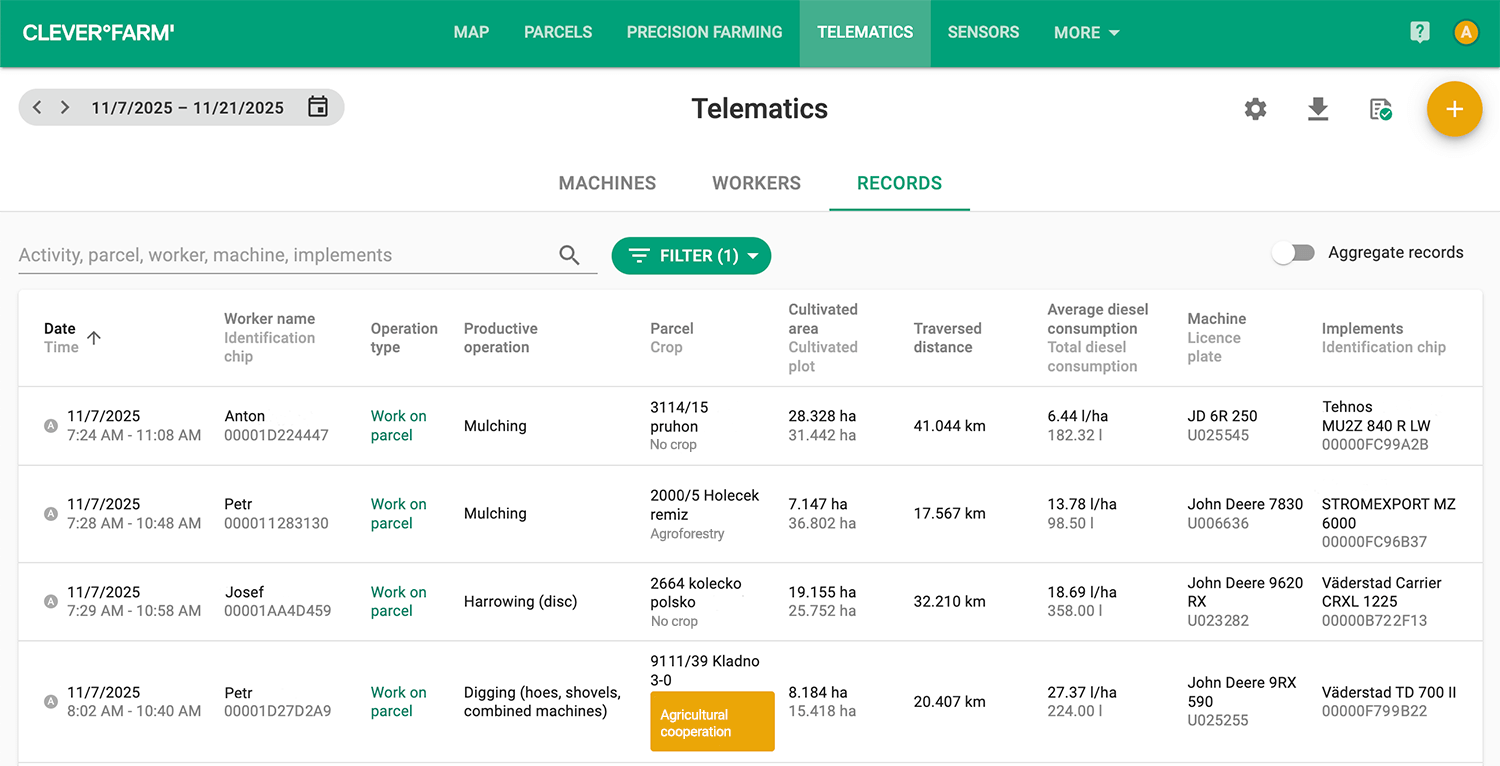
In the record detail, you can see the specific type of operation performed, such as transport; feed transport and handling; sowing; loading of grain, fertilizers, seeds, manure, hay, and straw; soil drainage; mulching; and other activities.
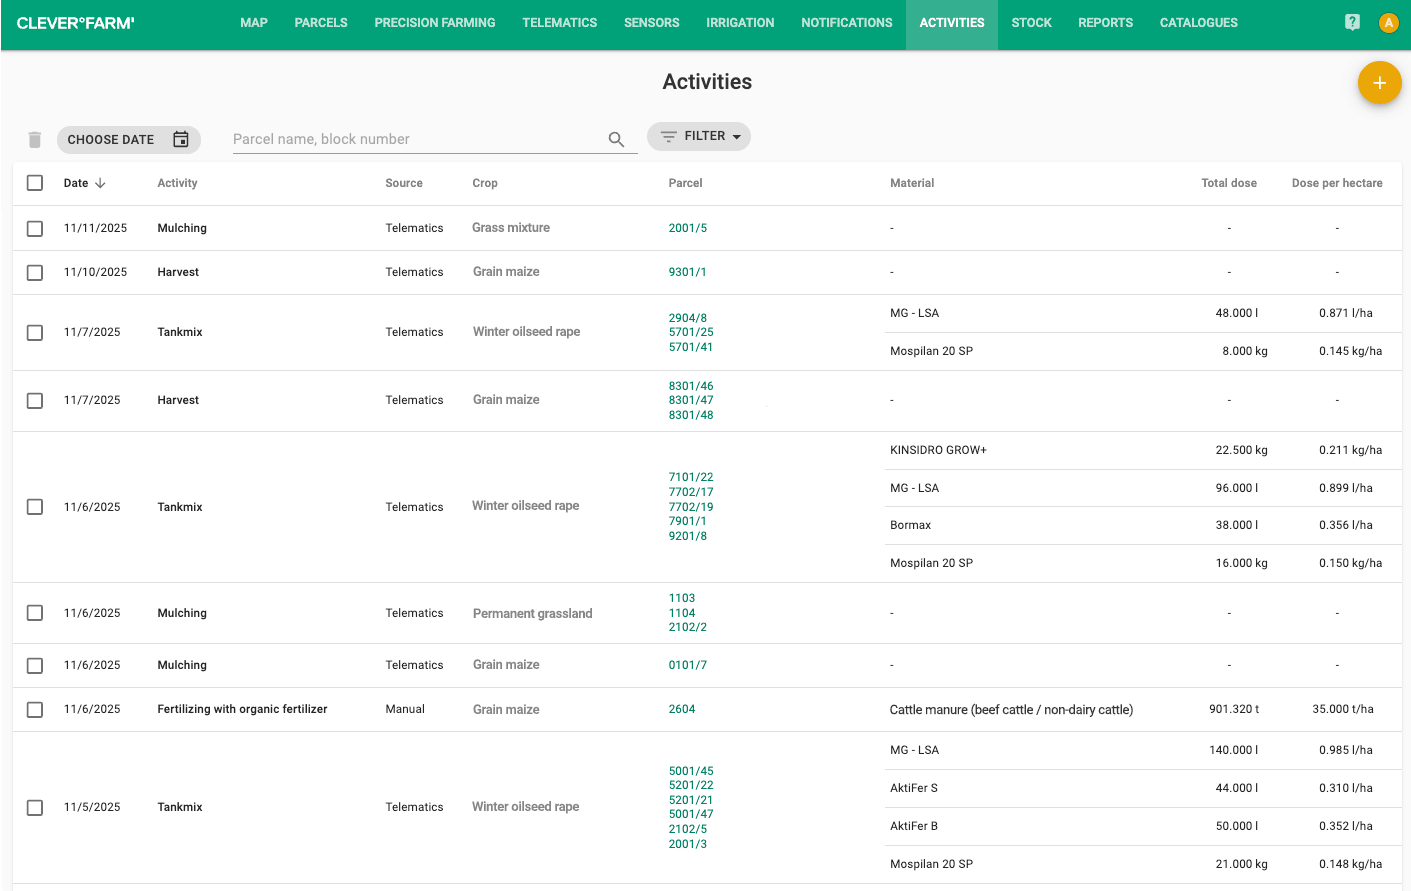
Records can be easily filtered by driver, operation type, or time period, which simplifies not only work tracking but also performance evaluation and billing. This gives you a clear overview of who did what work, when, and on which field. The records are then automatically transferred into agroevidence, eliminating the need for manual data entry.
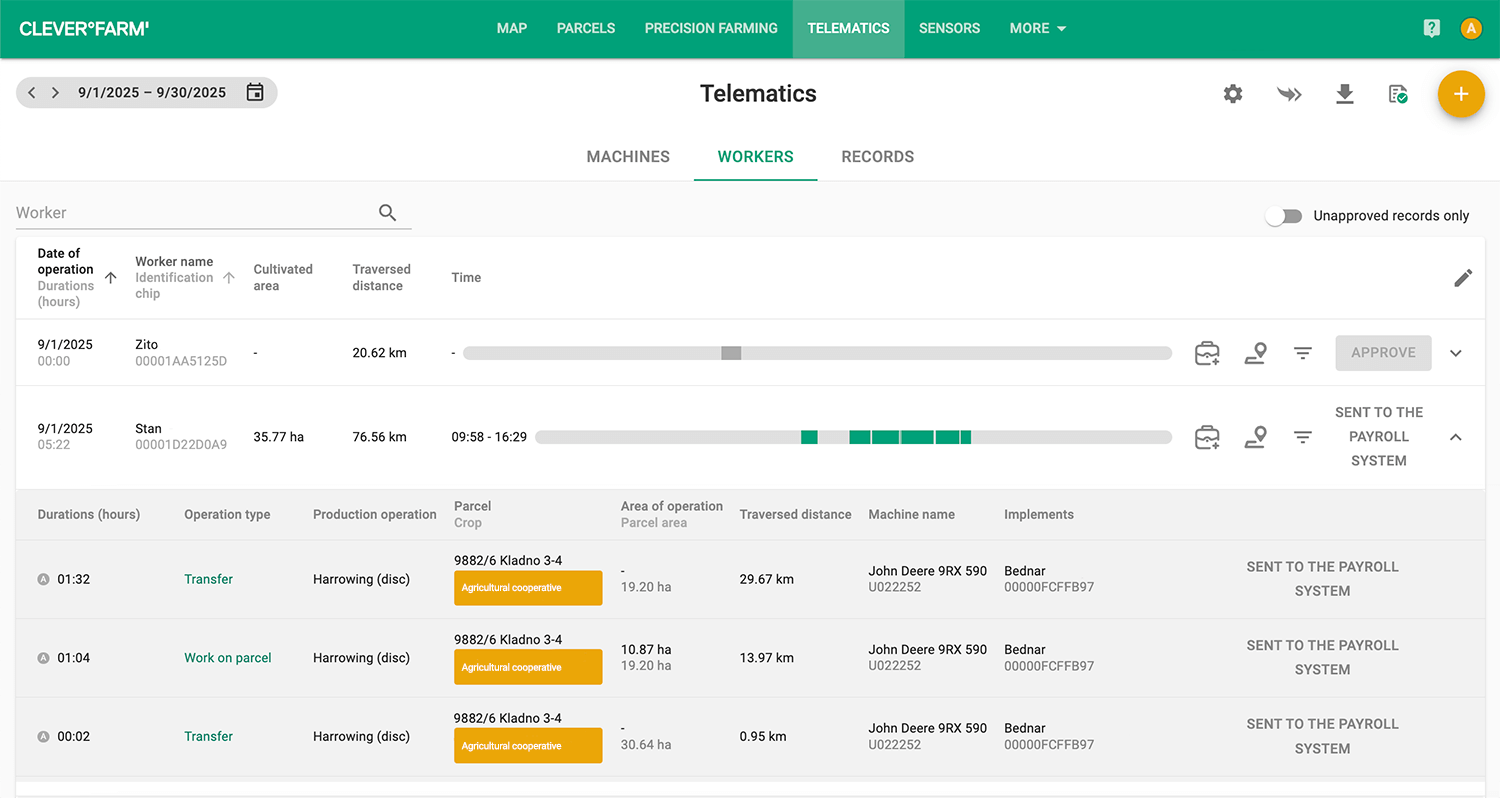
In the “Workers” tab, aggregated trips are displayed, summarizing all activities of a given driver on a single field. In the “Records” tab, you will find detailed information on when and where the driver worked, which operations were performed, and how much time was spent on the field.


.jpg)


%20(1).jpg)